Pie charts
Pie charts use different-sized sectors of a circle to represent data.
The FrequencyHow many times a value occurs. of each item is represented by the size of the angle of the sector.
They should be clearly labelled, either directly on the pie chart or by means of a colour-coded key.
Constructing a pie chart from a frequency table
To produce a pie chart, data is required. The data often comes in the form of a table.
To create a pie chart, the size of the angles needed must be calculated.
- Add the total frequency in the table.
- Divide 360┬░ by the total frequency.
- Multiply each frequency by this value. These are the angles for each sector.
- Construct a circle and draw a vertical line from the top to the centre.
- In a clockwise direction, use a protractor to plot each angle in turn.
- Label each sector or use a key to colour code each.
- Give your pie chart a title.
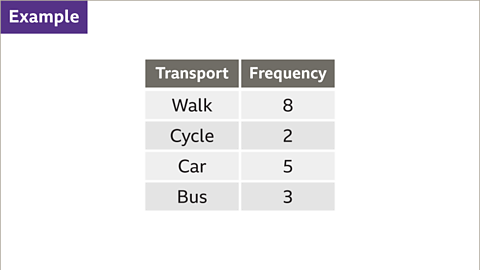
Image caption, A student asked their friends how they got to school. The table shows the results. Construct a pie chart to represent the data.
Image caption, To construct a pie chart the angles needed must be calculated. First, add the frequencies. In this table the frequencies total 18
Image caption, Divide 360┬░ by this value. 360 ├╖ 18 = 20┬░. This means each friend is equivalent to 20┬░ in the pie chart.
Image caption, Multiply each frequency by 20 to calculate the angles required. Walk = 8 ├Ч 20 = 160. Cycle = 2 ├Ч 20 = 40. Car = 5 ├Ч 20 = 100. Bus = 3 ├Ч 20 = 60. These angles should add up to 360┬░. If they do not add up to 360┬░, something is incorrect.
Image caption, To plot the pie chart, start by constructing a circle. Use a pair of compasses. Add a vertical line from the centre to the top of the circumference.
Image caption, The first sector to be drawn is to represent the friends who walk to school. This angle needs to be drawn at 160┬░. Position the protractor on top of the circle so that the origin is on the circleтАЩs centre and the zero on the outer degree scale is aligned with the vertical line. Mark the angle at 160┬░. Remove the protractor and draw a straight line from the centre passing through this point.
Image caption, The second sector to be drawn is to represent the friends who cycle to school. This angle needs to be drawn at 40┬░. Rotate the protractor, keeping the origin on the centre of the circle, and with the zero on the outer degree scale now aligned with the previous line. Mark the angle at 40┬░. Remove the protractor and draw a straight line from the centre passing through this point.
Image caption, The same image of the partially constructed pie chart as the previous. The protractor has been rotated such that the origin of the protractor remains on the central dot and the line plotted at one hundred and sixty degrees is aligned to the zero on the outer scale of the protractor. A line has been plotted from the centre at an angle of forty degrees. Written left: Second sector plotted at forty degrees. A pencil has been drawn at the end of the plotted line.
Image caption, The third sector to be drawn is to represent the friends who use a car to travel to school. This angle needs to be drawn at 100┬░. Again, rotate the protractor , keeping the origin on the centre of the circle and aligning the zero on the outer degree scale with the previous line. Mark the angle at 100┬░. Remove the protractor and draw a straight line from the centre passing through this point.
Image caption, All that is left to do is to label the pie chart and give it a title. Each sector can be labelled, or it can be colour coded with a key. An appropriate title for this example would be тАШA pie chart to show mode of transport to schoolтАЩ.
1 of 10
Interpreting pie charts
The frequency of each item is represented by the angle of each sector in a pie chart.
To calculate the frequency for a sector:
- Measure the angle for the sector using a protractor;
- Write the angle as a fraction of the full circle, 360┬░
- Multiply by the total frequency.
Example
This pie chart shows the outcomes of 24 rugby fixtures.
It is clear to see that the team won most of their matches as win is the largest sector and it is more than half.
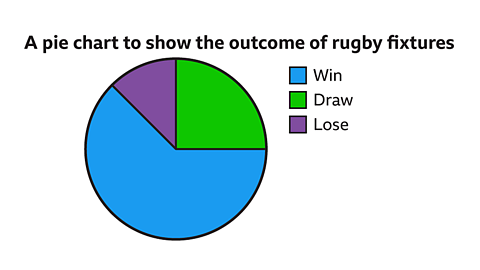
How many games did the team draw?
Answer:
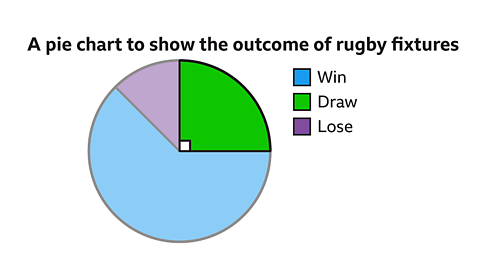
Draw is the green sector.
Measure the angle for the sector using a protractor;
The angle for draw is 90┬░Write the angle as a fraction of the full circle, 360┬░
\(\frac{90}{360}=\frac{1}{4}\)Multiply by the total frequency.
\(\frac{1}{4}=\times 24 = 6\)
The team had 6 draws.
How many games did the team win?
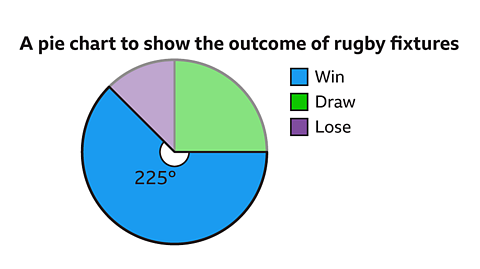
Measure the angle for the sector using a protractor;
The angle for draw is 225┬░Write the angle as a fraction of the full circle, 360┬░
\(\frac{225}{360}\)Multiply by the total frequency.
\(\frac{225}{360}\times 24 = 15\)
The team won 15 games.
A pie chart may have percentages to show what each part represents.
To calculate the frequency from a percentage:
- Write the percentage as a fraction of 100.
- Multiply by the total frequency.
Example
This pie chart shows the favourite hobbies of 660 pupils.
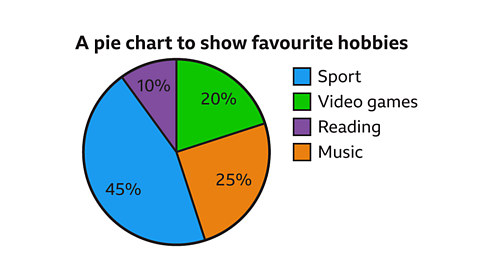
How many pupils said sport was their favourite hobby?
To calculate the frequency from a percentage:
Write the percentage as a fraction of 100.
\(\frac{45}{100}\)Multiply by the total frequency.
\(\frac{45}{100} \times 660 = 297\)
Sport was chosen by 297 pupils.
Question
The pie chart shows the types of pizza sold during one evening at MiloтАЩs Pizza Van.
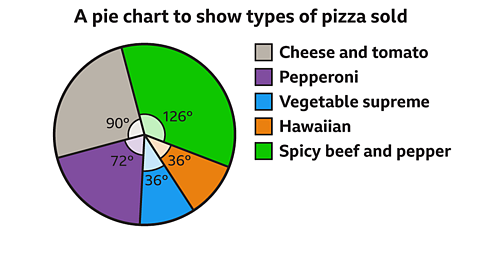
How many of the 240 pizzas sold were spicy beef & pepper?
Answer:
\(\frac{126}{360} \times 240 = 84\)
84 pizzas were spicy beef and pepper.
Test yourself
More on M1: Handling data
Find out more by working through a topic