Once data has been collected, it can be sorted and processed in different ways depending on the purpose of the survey. Finding an average value ÔÇô mean, median or mode - is often useful.
Mean
The mean is the most commonly used measure of average.
To find the mean of a list of numbers, add them all together and divide by how many numbers there are:
\(\text{mean} = \frac{\text{sum of all the numbers}}{\text{amount of numbers}}\)
Example
7 babies weigh the following amounts:
2.5 kg, 3.1 kg, 3.4 kg, 3.5 kg, 3.5 kg, 4 kg, 4.1 kg
Find the mean weight of the babies.
\(\text{mean} = \frac{2.5 + 3.1 + 3.4 + 3.5 + 3.5 + 4 + 4.1}{7} = \frac{24.1}{7} = 3.44 \) (2 dp).
The mean weight of the babies is 3.44 kg.
Median
The median is the middle value when the values are arranged in order.
Example
The weights of 7 babies are:
2.5 kg, 3.1 kg, 3.4 kg, 3.5 kg, 3.5 kg, 4 kg, 4.1 kg
Find the median weight of the babies.
Solution
The numbers are already in order.
The median is the middle value.
Cross off the first and last values:
\(\cancel {2.5 kg}, 3.1 kg, 3.4 kg, 3.5 kg, 3.5 kg, 4 kg, \cancel {4.1 kg} \)
Repeat until you reach the middle:
\(\cancel {2.5 kg}, \cancel {3.1 kg}, \cancel {3.4 kg}, \fcolorbox{RED}{white}{3.5 kg}, \cancel {3.5 kg}, \cancel {4 kg}, \cancel {4.1 kg}\)
The median weight of these babies is 3.5 kg.
An alternative method is to find which item of data is the median.
This is a more practical method if there are a large number of values.
There are 7 numbers, so adding 1 to 7 then dividing by 2 gives: \(7 + 1 = 8 \div 2 = 4 \)
The median value is the 4th number in the list:
| 1st | 2nd | 3rd | 4th | 5th | 6th | 7th |
| 2.5 | 3.1 | 3.4 | 3.5 | 3.5 | 4.0 | 4.1 |
The median weight of these babies is 3.5kg.
Median for an even number of values
If there are an odd number of values, there will be one middle value.
In the example above, there are 7 values. The median is the 4th value with 3 values on either side.
If there is an even number of values, there will be two middle values and the median is the mean of these values.
Example
If another baby was born that weighed 3 kg then the list would be like this:
2.5 kg, 3 kg, 3.1 kg, 3.4 kg, 3.5 kg, 3.5 kg, 4 kg, 4.1 kg
Now there are 2 items of data in the middle, so the median is half way between 3.4 kg and 3.5 kg, which is 3.45 kg
The median weight of these 8 babies is 3.45 kg.
Question
Ten Year 12 pupils were asked how many books they had borrowed from the library the previous term.
The responses were:
| 8 | 4 | 5 | 5 | 1 | 2 | 4 | 6 | 7 | 3 |
What was the median number of books borrowed?
Solution:
Put the numbers in order
| 1 | 2 | 3 | 4 | \(\fcolorbox{RED}{white}{4}\) | \(\fcolorbox{RED}{white}{5}\) | 5 | 6 | 7 | 8 |
Find the middle values
There are 2 middle values, 4 and 5.
\(\frac {4+5}{2} = \frac {9}{2} = 4.5\)
Answer:
Median number of books is 4.5
For the median or the mean, it's ok to have an answer that is not a whole number. No-one actually borrowed 4.5 books!
Mode
The mode or modal value is the number, or item, which occurs most often in a set of data.
There may be one mode, no mode or more than one mode.
Examples
| One mode | 4 | 5 | 6 | 6 | 6 | 8 | 8 |
| Mode is 6 - it occurs 3 times. | |||||||
| No mode | 4 | 5 | 6 | 7 | 8 | 9 | |
| No mode - all values occur only once. | |||||||
| More than one mode | 14 | 15 | 14 | 16 | 17 | 15 | |
| Modes are 14 and 15 - both occur twice. |
Question
Milo throws two dice and adds the numbers together.
He records the results shown below.
| 7 | 11 | 10 | 2 | 5 | 6 | 7 | 9 | 8 | 7 | 6 |
What is the modal result?
Solution
The mode is 7 - there are three 7's; it occurs most often.
Range
The range shows how spread out a set of data is.
The bigger the range, the more spread out the data.
A smaller range indicates that the data is closer together or is more consistent.
The range of a set of numbers is the largest value minus the smallest value.
Range = largest value Ôłĺ smallest value
Example
7 babies have the weights shown below:
2.5 kg, 3.1 kg, 3.4 kg, 3.5 kg, 3.5 kg, 4 kg, 4.1 kg
Find the range of the weights of the babies.
Range = biggest value Ôłĺ smallest value
4.1 Ôłĺ 2.5 = 1.6
Answer
The range of weights is 1.6 kg.
Question
The times taken, in minutes, for 12 students to complete an IT task are shown below.
24╠ř╠ř18╠ř╠ř17╠ř╠ř22╠ř╠ř21╠ř╠ř19╠ř╠ř17╠ř╠ř25╠ř╠ř23╠ř╠ř20╠ř╠ř19╠ř╠ř18
What is the range of these times?
Solution:
Range = biggest value Ôłĺ smallest value
25 -17 = 8
Answer:
Range = 8 minutes
Mean, median and mode from a frequency table
When data is presented on a frequency table, the mean, median and mode of the data can be found.
The table below shows the amount of goals scored in 10 football matches.
| Number of goals | Frequency |
|---|---|
| 0 | 2 |
| 1 | 2 |
| 2 | 5 |
| 3 | 1 |
Finding the mean from a table
The mean is found by adding up all the numbers and dividing by how many numbers there are.
To find the mean in this example, the total number of goals must be found and then divided by the number of games.
From the table, it can be seen that in 2 games no goals were scored. This makes a grand total of zero goals so far. The rest of the total amount of goals can be worked out in this way, by multiplying goals (\(x\)) by the frequency (\(f\)). Call this column \(fx\) (\(f\) multiplied by \(x\)).
| Number of goals \(x\) | Frequency \(f\) | \(fx\) | |
|---|---|---|---|
| 0 | 2 | 0 x 2 = 0 | |
| 1 | 2 | 1 x 2 = 2 | |
| 2 | 5 | 2 x 5 = 10 | |
| 3 | 1 | 3 x 1 = 3 | |
| Total | 10 | 15 |
The total number of goals is 15. There were 10 football games so \(15 \div 10 = 1.5\).
The mean number of goals is 1.5 goals per game.
Remember to divide \(fx\) by the total of the frequencies, not by the amount of different items of data ÔÇô the correct answer here is \(\frac{15}{10}\) not \(\frac{15}{4}\).
Finding the mode from a table
The modal value is the value that occurs most. From a table, this means the modal value is the one with the highestFrequencyHow many times a value occurs..
| Number of goals | Frequency |
|---|---|
| 0 | 2 |
| 1 | 2 |
| 2 | 5 |
| 3 | 1 |
There were five football matches where 2 goals were scored, which is a higher frequency than any other amount of goals.
The modal amount of goals scored is 2.
Finding the median from a table
The median value is the middle value when all items are in order. In this table, the amounts of goals are in order, as they start with zero goals and move up to three goals scored.
\(\text{Median} = \frac{n + 1}{2}\). To find the value that is the median for a set of items of data, add 1 to n and then divide by 2. The total frequency is 10, so there are 10 items of data.
| Number of goals | Frequency | |
|---|---|---|
| 0 | 2 | |
| 1 | 2 | |
| 2 | 5 | |
| 3 | 1 | |
| Total | 10 |
To find the median, work out \(\frac{n + 1}{2} = \frac{10 + 1}{2} = \frac{11}{2} = 5.5\) which means the median will be half way between the 5th and 6th items of data.
Go down the frequency column totalling the numbers until you find the category that contains the 5th and 6th items of data.
| Number of goals | Frequency | Cumulative frequency | |
|---|---|---|---|
| 0 | 2 | 2 | |
| 1 | 2 | 2 + 2 = 4 | |
| 2 | 5 | 4 + 5 = 9 | |
| 3 | 1 | 19 + 1 = 10 | |
| Total | 10 |
The third group starts with the 5th item of data, so the 5th and 6th items of data will both be 2. The median number of goals is 2.
Question

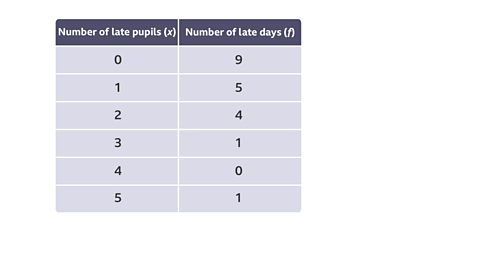
Image caption, Find the mean number of pupils who were late.
Image caption, Add an extra column
Image caption, Multiply to get fx values (0 x 9 = 0, 1 x 5 = 5 etc.)
Image caption, Add to find total number of days and total of fx values
Image caption, Divide to find the mean
1 of 5
Stem and leaf diagrams
A stem and leaf diagram shows numbers in a table format. It can be a useful way to organise data to find the median, mode and range of a set of data.
Example
The marks that a class score in a maths test are shown below.
| 22 | 29 | 31 | 27 | 30 | 11 |
| 16 | 28 | 40 | 27 | 35 | 36 |
| 45 | 38 | 37 | 30 | 28 | 21 |
| 9 | 17 | 18 | 29 | 41 | 42 |
A stem and leaf diagram is drawn by splitting the tens and units column. The tens column becomes the 'stem' and the units become the 'leaf'.
Stem and leaf diagrams must be in order to read them properly.
The 'leaf' should only ever contain single digits. Therefore, to put the number 124 in a stem and leaf diagram, the 'stem' would be 12 and the 'leaf' would be 4. To put the number 78.9 into a stem and leaf diagram, the 'stem' would be 78 and the 'leaf' would be 9. In this case, the key would indicate that the split between stem and leaf is a decimal.
In this example the Key: 4|5 = 45 marks. So a 4 in the stem column and a 5 in the leaf columns means 45. Indicating the stem had tens and the leafs are units.
Example

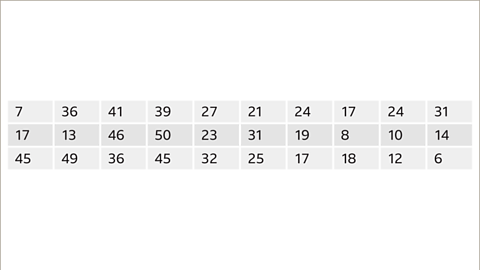
Image caption, A maths test is marked out of 50. The marks awarded to different students are shown in this table. This is difficult to interpret. It is not in order, and it is hard to see the highest or lowest score.
Image caption, Another way to represent this data is in a stem and leaf diagram. This diagram shows the same results as the table previously. Here it is clear to see that the highest score was 50 and the lowest score is 6
Image caption, Here is another set of scores from a science test. Put this data into a stem and leaf diagram.
Image caption, The first thing to do is put the data into ascending order and identify the groups. In this case, it would be sensible to group the data into ÔÇś0ÔÇÖ tens, ÔÇś1ÔÇÖ ten and ÔÇś2ÔÇÖ tens. These will be the stems for this diagram.
Image caption, The data is ready to be put into the stem and leaf diagram. For each group, remove the stem and add the leaf to the right-hand side.
Image caption, The final thing to add is a key which explains how to read the stem and leaf diagram. Choose one value and write what this means.
Image caption, Looking at the stem and leaf diagram, 2 is the smallest value and 29 is the largest value. 12 is the modal value as it appears the most.
Image caption, Here are the heights of 15 people in a class, in metres. Put the data into a stem and leaf diagram.
Image caption, Put the data into ascending order and identify the groups. In this case, it would be sensible to group the data so that it is shown increasing in size by a tenth e.g. 1ÔłÖ4ÔÇŽ, 1ÔłÖ5ÔÇŽ, 1ÔłÖ6ÔÇŽ and 1ÔłÖ7ÔÇŽ
Image caption, The data is ready to be put into the stem and leaf diagram. For each group, remove the stem and add the leaf to the right-hand side. Remember to include a key which explains how to read the stem and leaf diagram.
1 of 10
Median and Range from a Stem and Leaf Diagram
Example
The stem and leaf diagram shows the ages of patients in a clinic's waiting room
Use the diagram to find
- the median age
- the range of the ages
Answer
The values on the stem and leaf are already in order.
The median mark is the middle mark. There are 17 values so to the median value is the 9th.
Answer: The median age is 65.The range of ages = largest value - smallest value
= 84 - 50 = 34
Answer: The range for the ages is 34 years
Test yourself
More on M1: Handling data
Find out more by working through a topic
- count3 of 6
